
HOUSING FUTURES | Attention: AI
In this next installment of our Housing Futures series, we look at this profoundly complex subject and attempt to establish a framework through which we might begin to productively identify, organize, and make sense of some of the most critical ‘moving parts’ that have stymied the housing market for decades now.
Anyone who has attempted to navigate the vast mass of data relating to our housing market will tell you three things:
1) It’s Complicated. Buildings tend to stay put while people do not. Similar observations may apply to market policies and market preferences, personal origins and professional opportunities, along with speculative ambitions and economic outcomes.
2) It’s Varied. There are countless resources for aggregating housing data. While many do a great job at remaining neutral and objective, some sources are subject to spin while overall collection methodologies are mixed.
3) It’s Incomplete. Relative to supply and demand, there are numerous places where the data fall short especially with vacancies and losses. Vacancy rates typically equate to what is available—on the market. Numerous types of ‘hidden’ vacancy rates / indexes do exist—short-term rentals, 2nd homes, foreclosures, etc.— but they rely on reporting and ‘hidden’ is an operative word here. In terms of losses, major storm events, fires, legal disputes, and many other circumstances can add considerably to the confusion.
In an attempt to gain some ground on this issue we decided to engage AI. As part of an ongoing research effort we are customizing a GPT using Open AI that we’re calling PLAN DMV. In the spirit of scientific method we’ve created a similar customization using ANTHROP\C’s CLAUDE. Both customizations have utilized the same overarching parameters. Additionally, we have posed all of our inquiries to IBM’s Watsonx AI for a third POV.
Included within the body of this brief you will find various links to chat threads providing more in-depth access to the data. We encourage you to explore these chat threads further with your own inquiries.
Think Global | Act Local
Housing is a national issue with many implications for Federal engagement and support. But, generally speaking, housing happens at home, as it were, and is fundamentally a local issue. National data may set the stage with macroeconomic trends and broader shifts, but regional data is where effective, actionable insights are generated and carried out.
As a region, the DMV* [DC, MD, VA] has some very unique challenges. At the macro level there are two state governments and a district administration subject to Congressional oversight. At a more granular level, there are six county administrations in MD, four county and two independent city administrations in VA, and eight wards in DC. Ours is a robust region with a diversity of views posing unique challenges for cross-jurisdictional coordination—to say the least.
For the sake of clarity we will be focusing this initial inquiry exclusively on the DMV rental housing market. We will first assess the current supply and demand estimates—including deficits. We will then establish 5-year growth projections, looking at the potential distribution of those units across the DMV. Within this context we will apply the following criteria: areas of opportunity and disposition of housing types. Again, for the sake of clarity, we will be focused on multifamily housing with a provision to promote missing-middle.
*The DMV does not include ALL counties in MD and VA. Just those identified herein.
Rental Housing In The DMV
There are four primary categories of rental housing: subsidized, affordable, workforce, and market rate. Each category is affiliated with corresponding Area Median Income [AMI] rates.
-
Subsidized Housing is developed for low-income households, funded largely by Federal programs. Tenants generally pay a fixed portion of their income (up to 30%), and the subsidy covers the remainder of the rent or housing cost.
-
Affordable Housing is developed for low- to moderate-income households, funded by a combination of federal, state, and local programs like Low-Income Housing Tax Credits (LIHTC) or housing vouchers.
-
Workforce Housing is developed for essential workers—teachers, nurses, first-responders, and others— who earn too much to qualify for traditional affordable housing but not enough to afford market-rate housing.
-
Market Rate Housing includes units that are rented at the going market price without income restrictions. This is the most common type of housing in the DMV region.
It should be noted that various niche-market categories such as senior / assisted living can be viewed as a subset of any of the above categories.
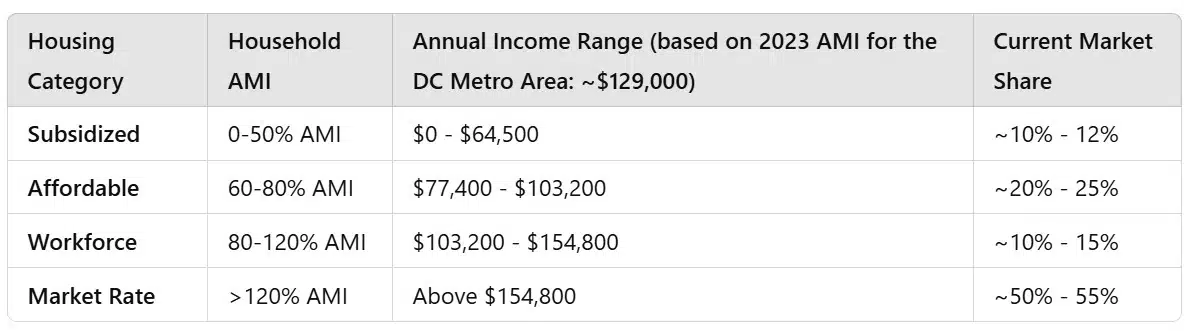
 Housing Categories with Affiliated AMI Figures, Current DMV Market Share Rates, Supply and Shortfall Estimates.
In order to assess the current market conditions for the four primary housing categories, we consulted with the PLAN DMV GPT to establish our initial estimates. We then ran those by the CLAUDE and Watsonx AI models for confirmation—both of which generally confirmed the alignment of those numbers approximating a current overall shortage of 105,000—165,000 units in the DMV.
From there we asked our AI models to provide a breakdown of these figures according to municipalities.
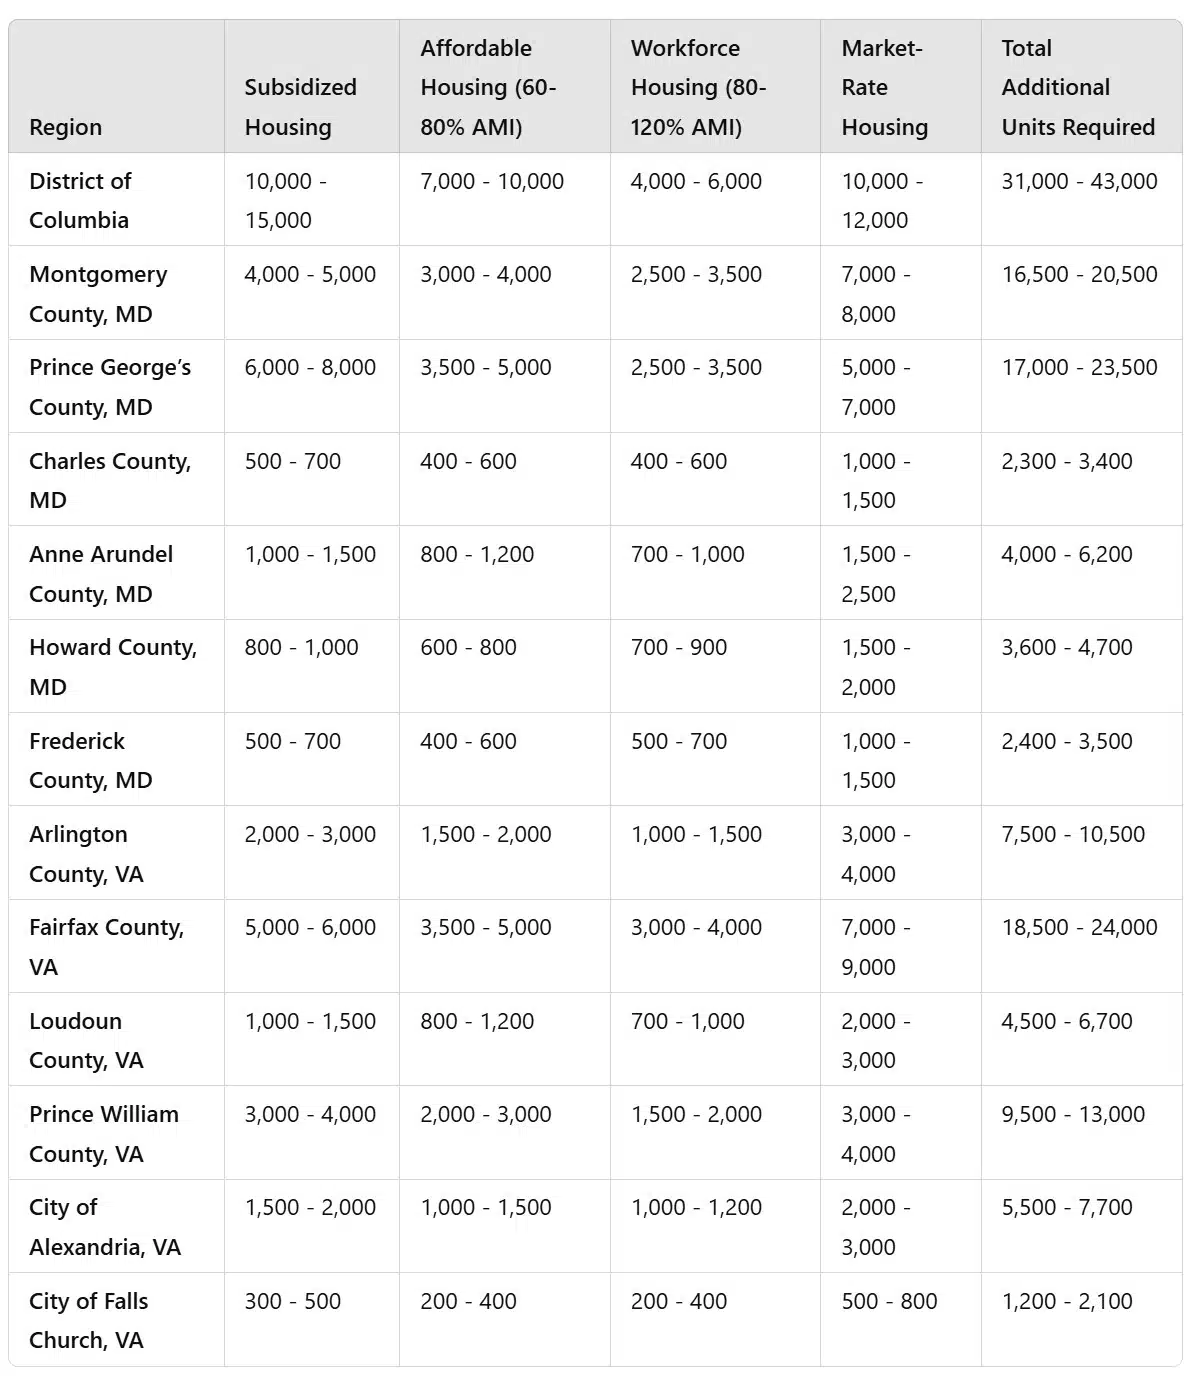 Current Housing Shortage Estimates by Category and Grouped According to Municipality
We then asked our models to consider the current unit shortage and project 5-years out to identify the number of units that could be reasonably expected to accommodate increasing demand. In addition to identifying the needs per housing category—grouped according to municipality—we also requested a break-down of appropriate housing typologies with consideration being given to missing-middle.
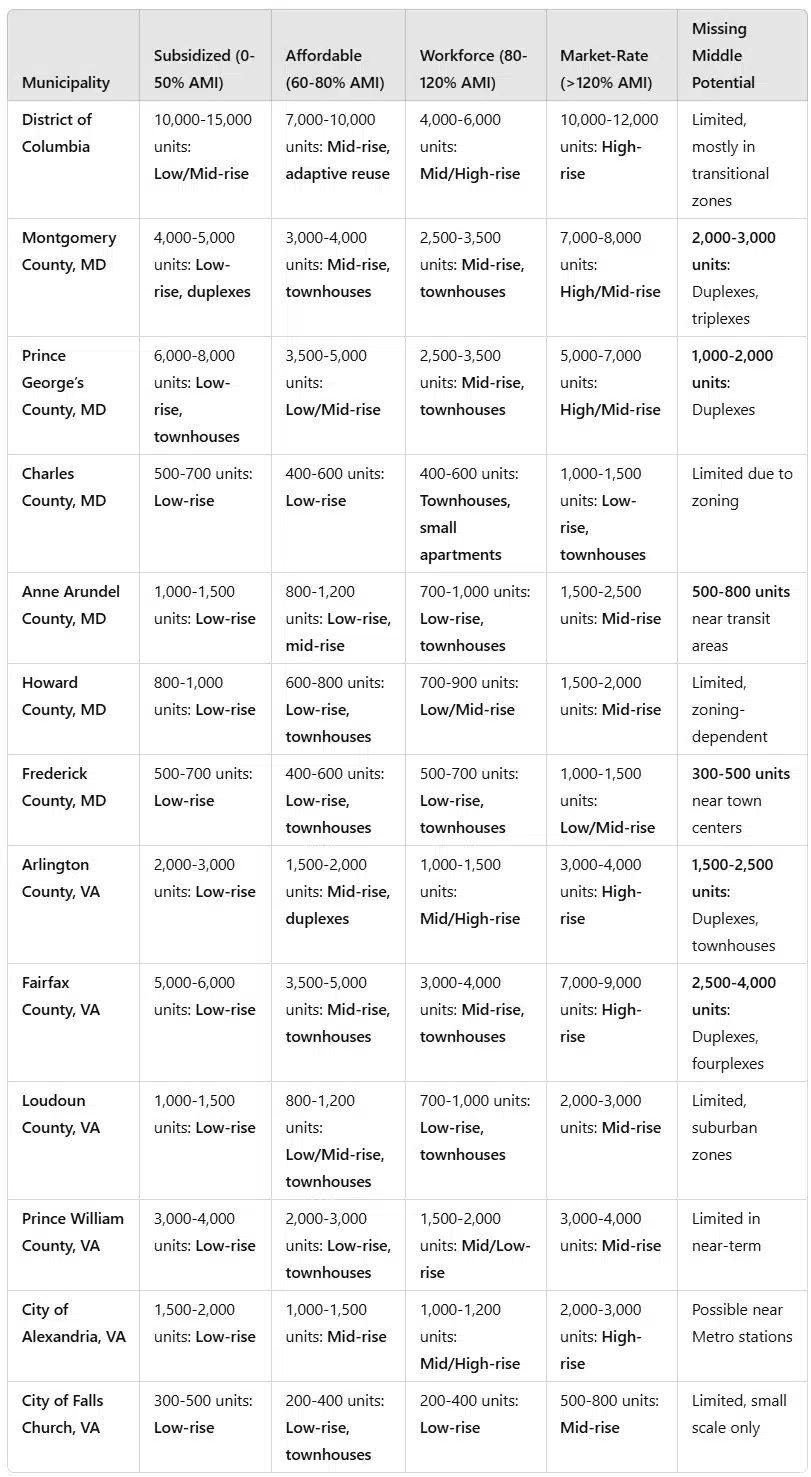 5-Year Projection for Contending wit the Current Shortage and Accounting for Projected Growth. Break-Down Includes Suggested Building Typologies with Consideration Given to Missing Middle.
It should be noted that to generate a table like the one above, a good deal of fine-tuning needs to go into the prompting. For example, when recommending a particular building typology in a particular locale, the model needs to be reminded to factor-in existing zoning and building codes, prevailing building typologies and construction types normally affiliated with projects in each of the four housing categories. Some counties are known for more involved entitlements resulting in increased costs for certain building types; the list goes on… This is really just a first pass and is still in need of meaningful tweaking.
Conclusion…Next Steps
This is just the beginning of our efforts in this arena and, to be clear, it’s a very crude first step. But it’s a start…
If there is one major take-away on our end, it’s that this effort can genuinely proceed from a regional approach. While there are MANY more data sets to implement or build-in here, there is nothing to prevent a coordinated effort.
Assuming some sense of consensus can be developed around some set of required unit projections, it would be optimal to initiate a parallel study identifying potential areas for development including but not limited to an array of underutilized sites—from failing or failed retail or office properties to Federal- and municipal-owned properties.
Other tandem studies will need to include homes for sale as well as sub-studies to evaluate proposals to reform zoning to expand missing-middle and potentially allow for point-access block [single-stair] multifamily. It is worth remembering that both missing middle and point-access block typologies can circumvent costly land assembly activities. Office to residential should also be evaluated within this context.
Again, this is a huge issue and we have barely scratched the surface here, but we are excited by what we’re seeing in the AI | LLM space and we see tremendous potential implications for planning and development.
![]()